
Using conditional formatting, you can easily draw attention to certain data or make cells stand out. Depending on the conditions, a certain set of cells will take on a new look (or criteria).
With this feature, you can focus on cells that contain values that fulfill a certain criterion.
Several cell formats are available depending on a wide variety of parameters.
In this post, we’ll go over 6 various options you may take to apply conditional formatting to the selected cells in Excel.
What are the 3 Conditional Formatting Options?
Although there are several conditional formatting options you can use to highlight or format cells based on specific conditions, only three of them are the most prominent ones.
- Highlight Cell Rules: This option allows you to highlight cells that meet certain conditions using different formatting styles. You can choose from various rules such as greater than, less than, between, equal to, and more.
- Top/Bottom Rules: With this option, you can highlight the top or bottom values in a range of cells. You can specify whether you want to highlight the top or bottom percentage, number of items, or specific values.
- Data Bars, Color Scales, and Icon Sets: These options allow you to apply visual gradients to represent the relative values in a range of cells. Data Bars create horizontal bars within cells, Color Scales apply a color gradient to cells, and Icon Sets use icons (such as arrows, symbols, or traffic lights) to indicate the relative value of each cell.
How to Apply Conditional Formatting To The Selected Cells in Excel
There are so many ways you can use conditional formatting to the selected cells in Excel. However, we will now show you 6 different methods which you can use to do your job.
For your greater understanding, we are going to use a product price list data table to guide you through.
Here are the steps to apply conditional formatting based on selected cells:
1. Use The Highlight Cells Rules Option
If you want to highlight a set of cells based on different conditions, this is the option you are looking for. By using the Highlight cells option located under the Conditional Formatting option, you can easily colorize a set range.
Now, let’s see how we can make use of this feature:
-
- Open up your Excel file and choose the cell range where you want to use the highlight cells option.
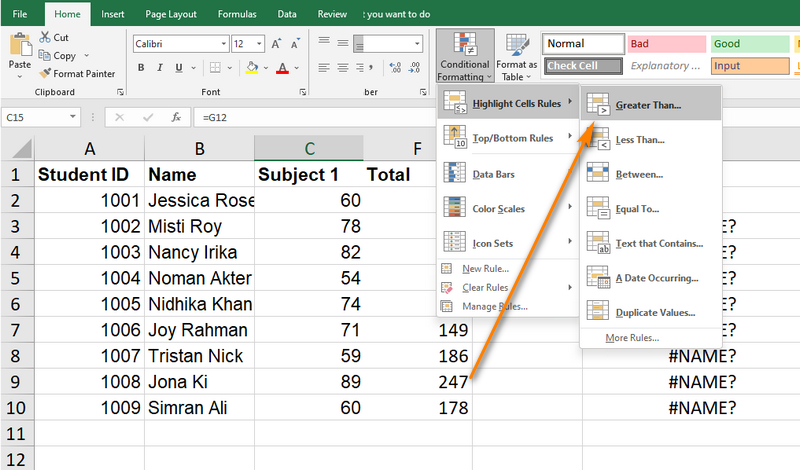
- Choose the Highlight Cells Rules by navigating to Home > Conditional Formatting.
- Choose your preferred option. In our case, we chose the Greater Than option. Each one of these commands can be applied as needed. As an example, the Greater Than command will highlight any numbers that are higher than the threshold you provide. From the drop-down menu, pick Greater Than to open the corresponding dialogue box.
- Enter your desired number. We entered $2,000 in the box.
- Click on the OK button.
In doing so, any cells with values larger than $2,000 will be highlighted as seen below.
There are many other options available for highlighting cells. Each of these options works differently. For example:
- Less than: Shows in bold any cells where the current value is less than the one you enter.
- Between: Finds any cells that have a value between two specified values and highlight them.
- Equal To The cell range containing the entered value is highlighted.
- Text That Contains: The text entered into the dialogue box is used to determine which cells to highlight.
- A Date Occurring: Specifically, it highlights the data that was created on a certain date.
- Duplicate values: With this option, the cell(s) containing duplicate values are highlighted.
2. Apply The Top/Bottom Rules Option
With the help of Top/Bottom Rules, we will be able to highlight a certain number of cells at the top or bottom of a given cell range.
Here are the steps you need to take to use this command:
- Open up your Excel file and choose the cell range where you want to use the highlight cells option.
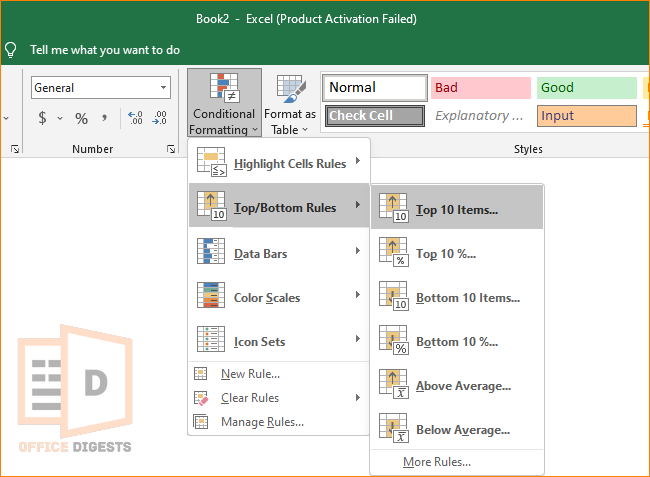
- Choose the Top/Bottom Rules by navigating to Home > Conditional Formatting.
- Select your preferred option. In our case, we chose the Top 10 Items option. Each one of these commands can be applied as needed.
- Give your command in that box. For example, click the up or arrow button to decide how many cells you want to rank with which color. You can change the color using the drop-down menu.
- Click the OK button, the Top 10 Items command will highlight the very first ten items from the selected cells.
As we know, there are many other options available! Other options are described below:
- Top 10%: The first 10 per cent of the contents of the range of selected cells will be highlighted by this command.
- Bottom 10 Lists: If you choose a range of cells, it will highlight the lowest 10 items in that range.
- Bottom 10%: Using this command, the bottom 10% of the chosen cells will be highlighted in the specified colours.
- Above Average: This highlights any cell that has a value greater than the average.
- Below Average: Any cells with values far below average will be highlighted.
3. Implement the Data Bars Option
An intriguing feature, Data Bars, emphasizes cells with coloured bars that correspond to the values in the cells. Hence, a cell with a greater value than the other cell with a low value will be highlighted with a larger bar of colors.
Here’s how to put this functionality to use:
- Open up your Excel file and choose the cell range where you want to use the highlight cells option.
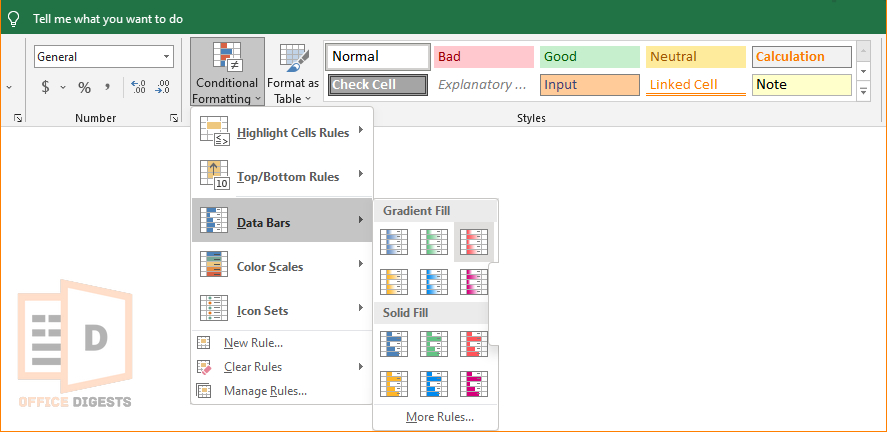
- Choose the Data Bars option by navigating to Home > Conditional Formatting.
- Keep in mind that these colors are in two types one is Gradient Fill, and another one is Solid Fill. Choose your preferred one. In our case, we chose the first option. Each one of these colors can be applied as needed.
4. Choose Color Scales
Now it’s time to use the Color Scales option. You may use the Color Scales option to highlight cells in a variety of colors according to their values.
That’s because this function lets you assign different colors to distinct cell values. Using this function is as simple as following the instructions provided below:
- Choose the cell range where you want to use the highlight cells option.
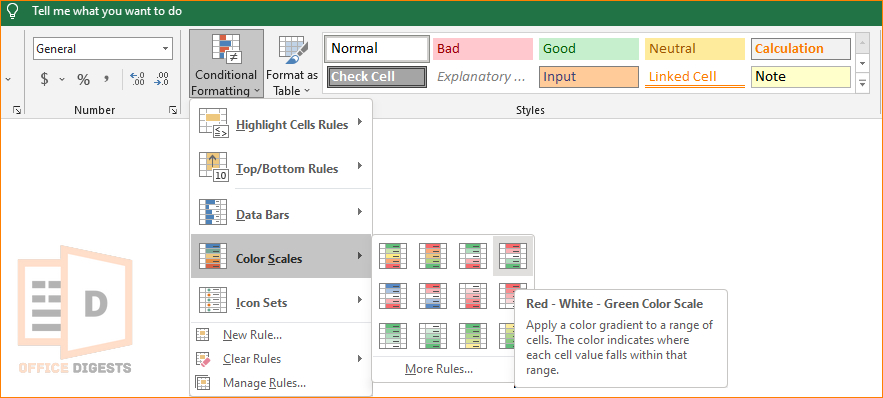
- Select the Color Scales option by navigating to Home > Conditional Formatting.
Once you click the Color Scales Rules option, you will get a whole bunch of colorized options. So, when you put your mouse cursor on the first option, it will show you a message that says Green, Yellow, and Red color scale.
That means if we choose this color scale on a set of cells, then the biggest value will be colourised with the green color.
5. Select the Icon Sets Option
In the previous section, we discussed Color Scales conditional formatting. It was a great way to highlight selected cells.
But now, we have even more awesome techniques which will make your spreadsheet look even more attractive. This time, it is the Icon Sets option to apply conditional formatting to the selected cells.
The Icon Sets command designates icons for cells according to their values. This is an intriguing approach to data visualization in Excel.
If you have already clicked on the Icon Sets option, you may already know that there are 4 different types of icons available, each under four categories. Those 4 categories are:
- Directional
- Shapes
- Indicators
- Ratings
According to your spreadsheet type, you can choose whichever fits your sheet. But we are going to choose the Rating option as it looks attractive.
Now once we have clicked on the rating icon, it will give a result that looks like this:
![]()
A star is allocated to each of these three ids based on the total quantity present. A full star indicates the greatest amount, a blank star the least, and a half-filled star the median.
6. Create A New Rule
Tried all the methods listed above? Still hungry for more formation?
Don’t worry, pal, Excel has got your back covered. You may utilize New Rule to enable extra options to format cells if you find that you need more than the alternatives that were mentioned above.
In order to take advantage of this function, please proceed as outlined below:
Once you have clicked on the New Rule option, you will be presented with a dialogue box that says New Formatting Rule.
Below you’ll discover some more tools for formatting cells to your needs. To enter a formula, for instance, use the option “Use a formula to choose which cells to format.”
To highlight all cells in the quantity column with a value higher than 20, type the formula into that box. Afterwards, press the OK button.
A Few Things to Keep in Mind
- Before using Conditional Formatting, you should always choose your cells.
- If you make a mistake using Conditional Formatting, you can reverse it by pressing CTRL+Z.
Conclusion
Finally, we have shown you six different ways to apply conditional formatting to the selected cells in Excel. Make sure that you practice all the methods shown above so that you remember all the strategies.
Conditional formatting is a great way to combine Excel’s built-in functions. You can use any formula you like and format specific cells at the same time.