
The built-in funnel chart in Excel may not resemble an actual funnel shape. But there is a smart art option available for creating a pyramid-shaped chart if you are using Excel 2016 or later.
However, achieving the desired shape often requires modifying the data.
In this post, we will guide you through creating an optimal sales funnel chart that effectively tracks the progression of leads across different stages.

How Many Data Points Do Funnel Charts Require in Excel?
There is no specific requirement for the number of data points in a funnel chart. It’s generally recommended to have data for each stage of the funnel to accurately represent the flow and conversion rates.
A basic funnel chart typically consists of three stages –
- the initial data
- the middle stage(s), and
- the final outcome.
However, you can add more stages depending on the specific process you are analyzing.
NOTE: As the number of bars increases, the chart may become more crowded, and it might be challenging to visually interpret the data.
How To Create a Sales Funnel Chart in Excel
In this segment, we will be tracking the progression of leads through various stages of a sales funnel. You can customize the dataset by adding or modifying the stages and the corresponding number of leads.
Now, let’s look at the dataset.
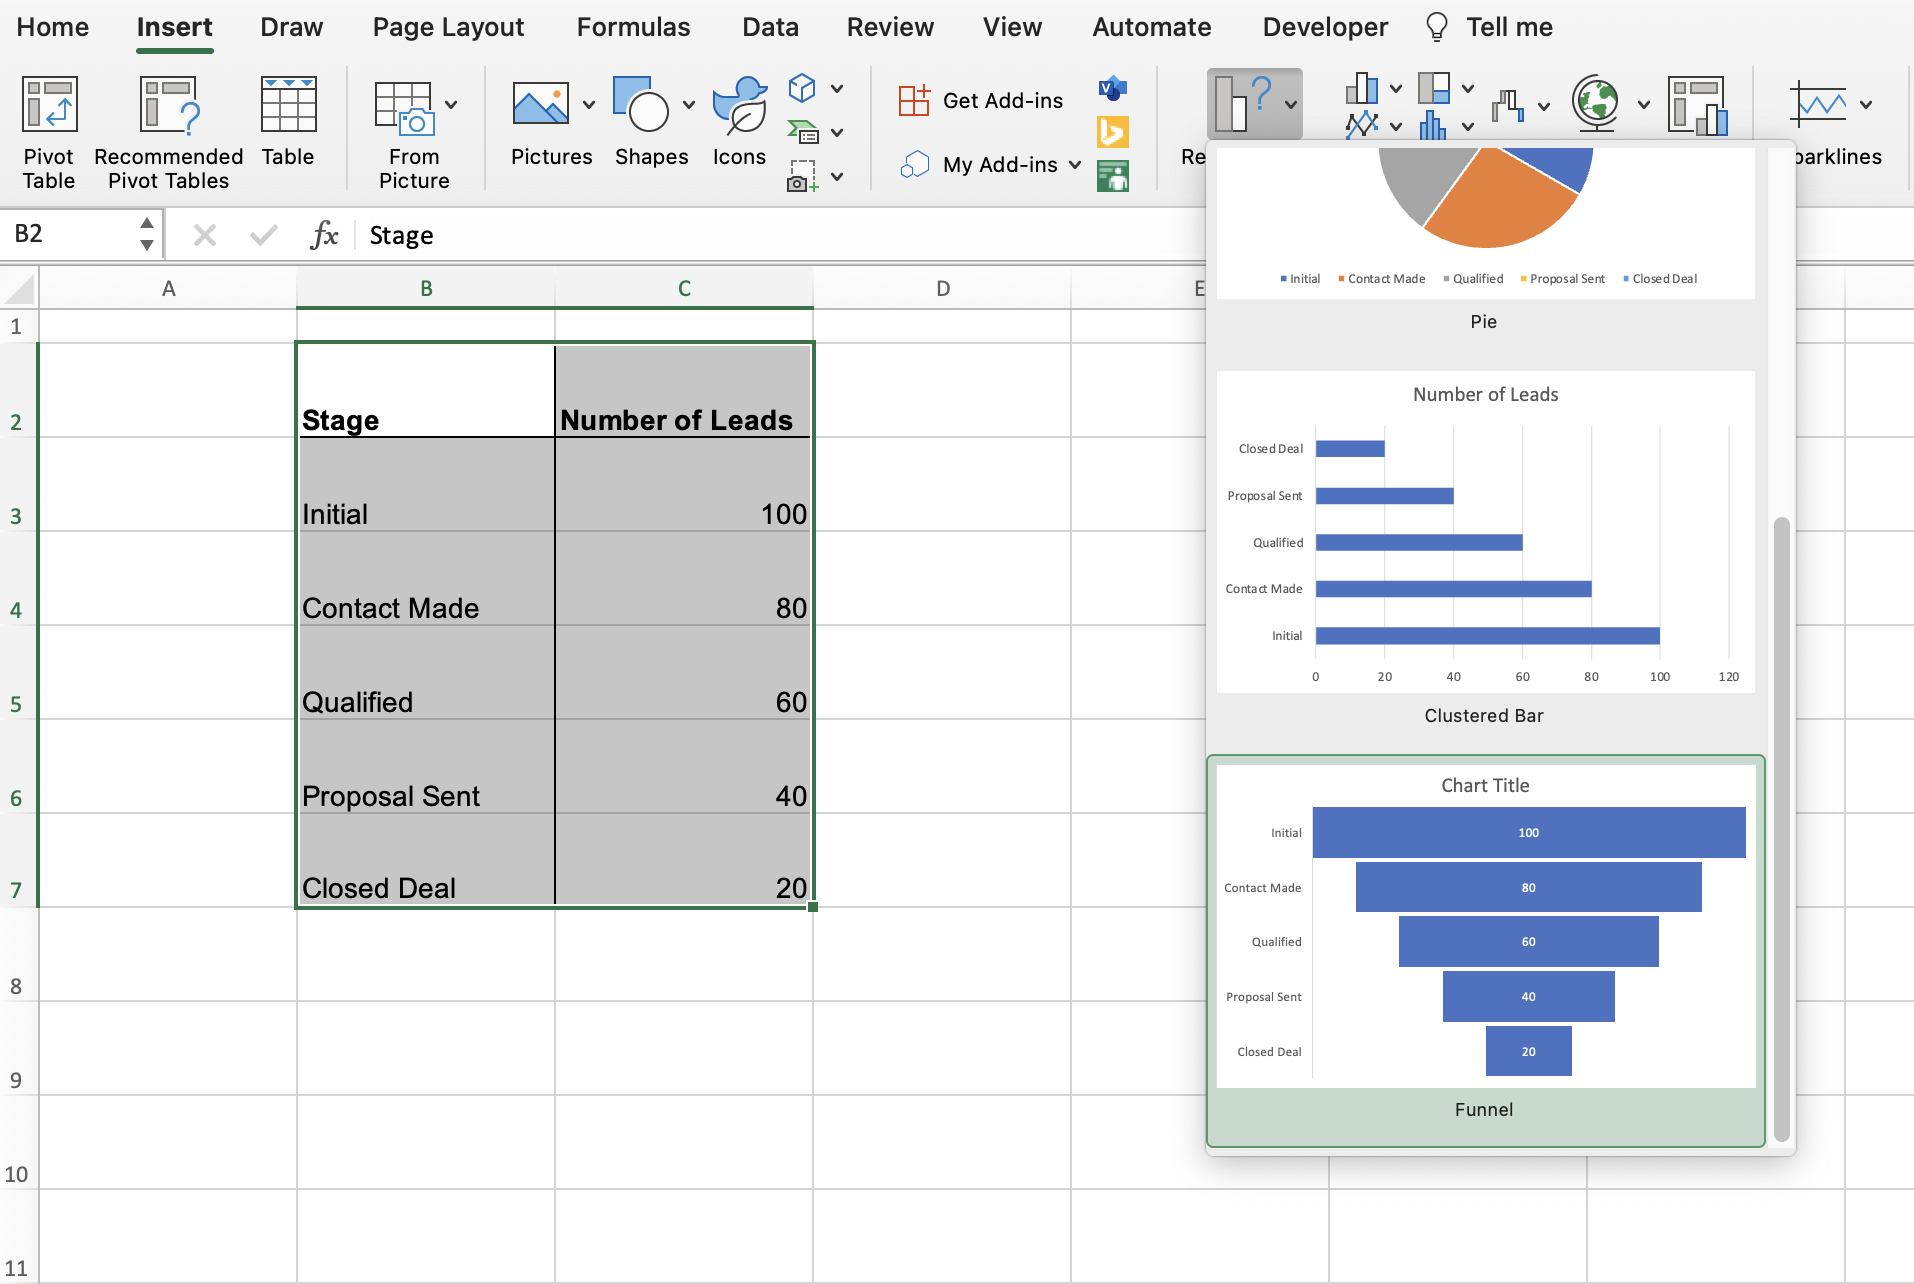
| Stage | Number of Leads |
| Initial | 100 |
| Contact Made | 80 |
| Qualified | 60 |
| Proposal Sent | 40 |
| Closed Deal | 20 |
Make sure the data is sorted in ascending/descending order to make your funnel chart more attractive.
Follow the steps to create a funnel chart in Excel:
1. Enter the Recommended Funnel Chart
Disclaimer: This method is only applicable for Excel 2016 or later.
After you have successfully entered your dataset in the Excel file, select the data and go to the Insert Tab. Click on the drop-down icon of the Recommended charts and select the Funnel Chart.
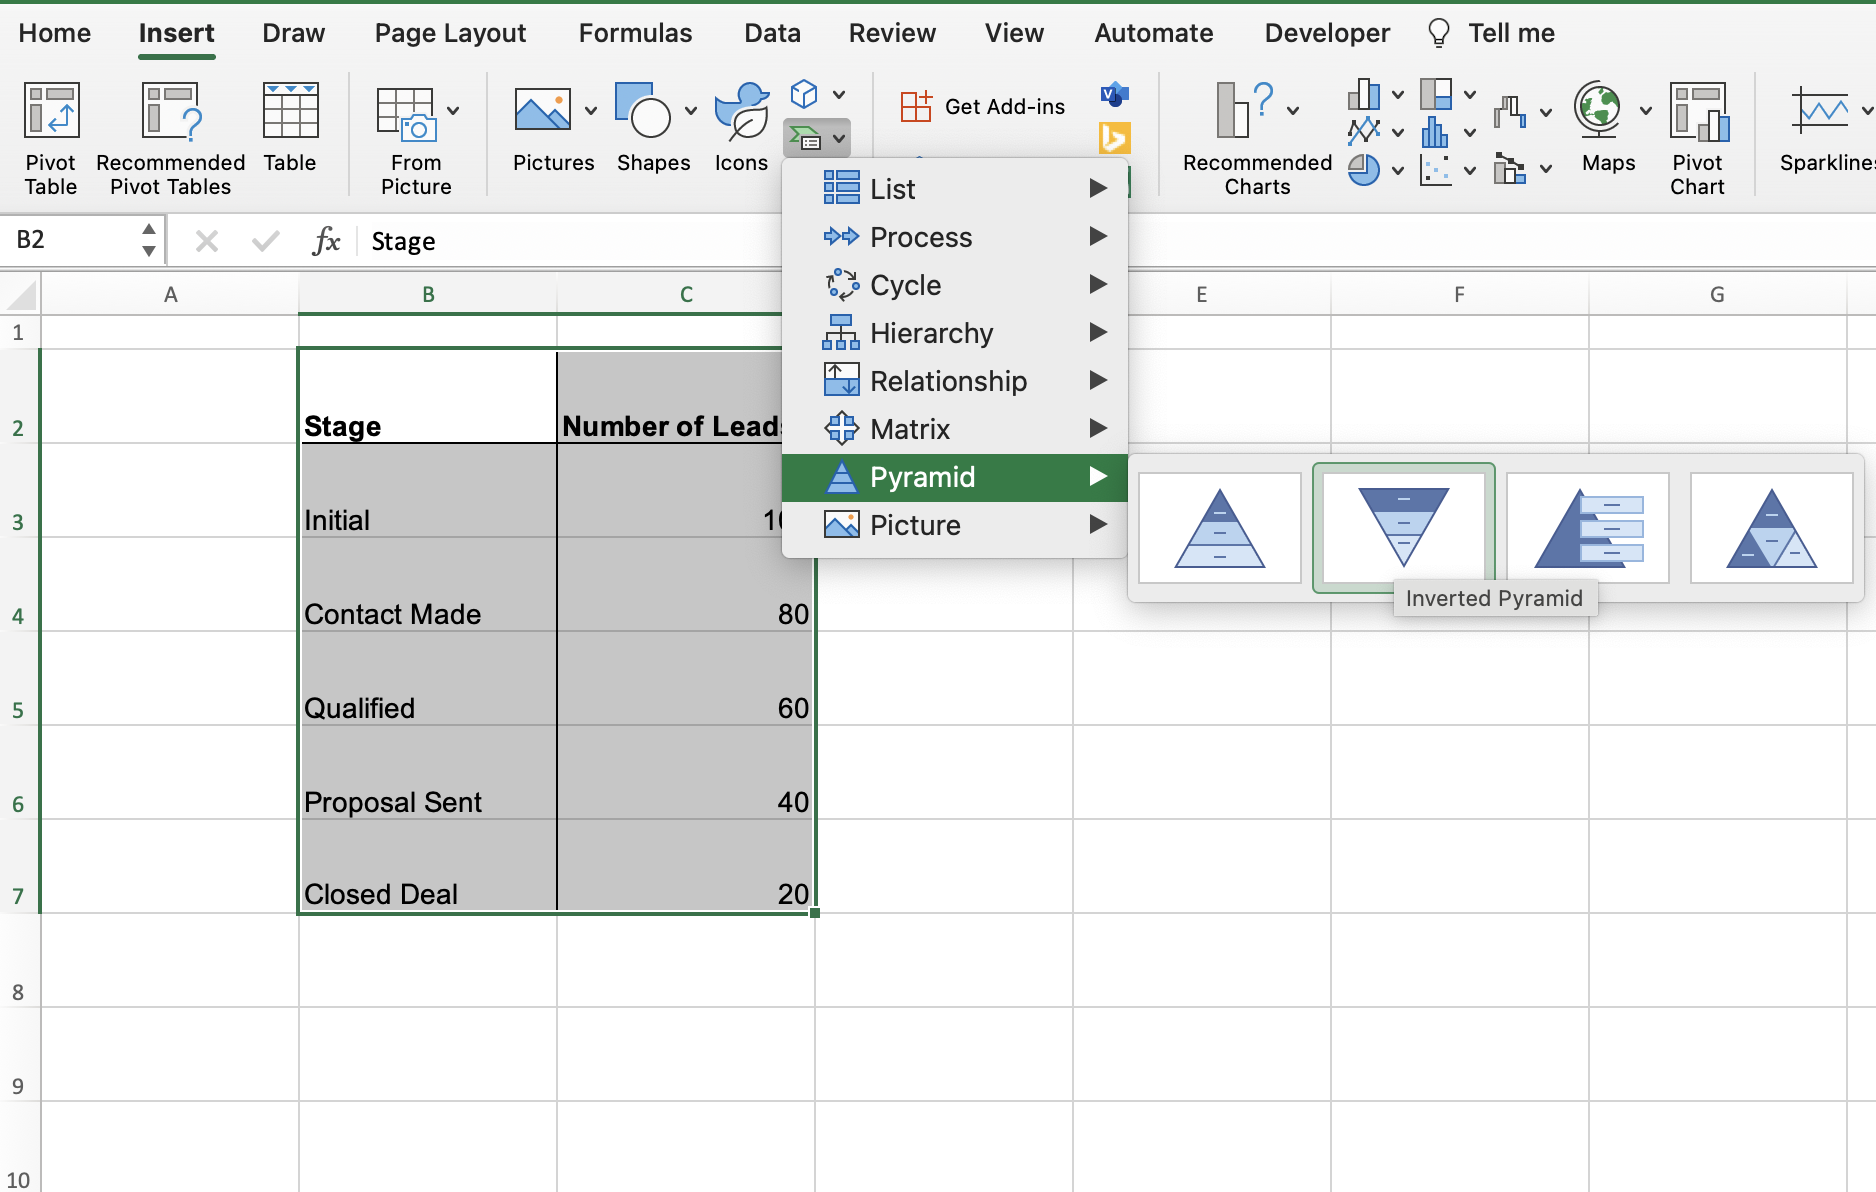
2. Insert an Inverted Pyramid Chart
Since the built-in funnel chart doesn’t actually look like one, we are going to reshape it.
Click on any empty cell and go to the Insert Tab. Besides the Icons Option you will see an option named Smart Art Graphic. Click on it and select the Pyramid option and then the inverted chart.
3. Add the Required Number of Shapes
Once you insert the inverted pyramid, add the required number of triangles as per your data. You can click on the Add Shape Button from the upper left corner of the ribbon bar.
According to our dataset, we need 5 shapes. So, let’s insert 2 more. Now that you are done, move to the next step.
4. Copy Individual Shapes But Don’t Paste It
Copy the first shape from the pyramid by clicking on it and pressing Ctrl+C keys on your keyboard. You can first color your pyramid if you want to and then copy the cell.
5. Format Data Point as Picture
Double-click the first shape from the funnel chart. This will open the Formatting options for the Data Series. Click on the Dropdown menu for the Fill options. Select the option Picture or Texture Fill. Under the Picture Source Option, click on Clipboard.
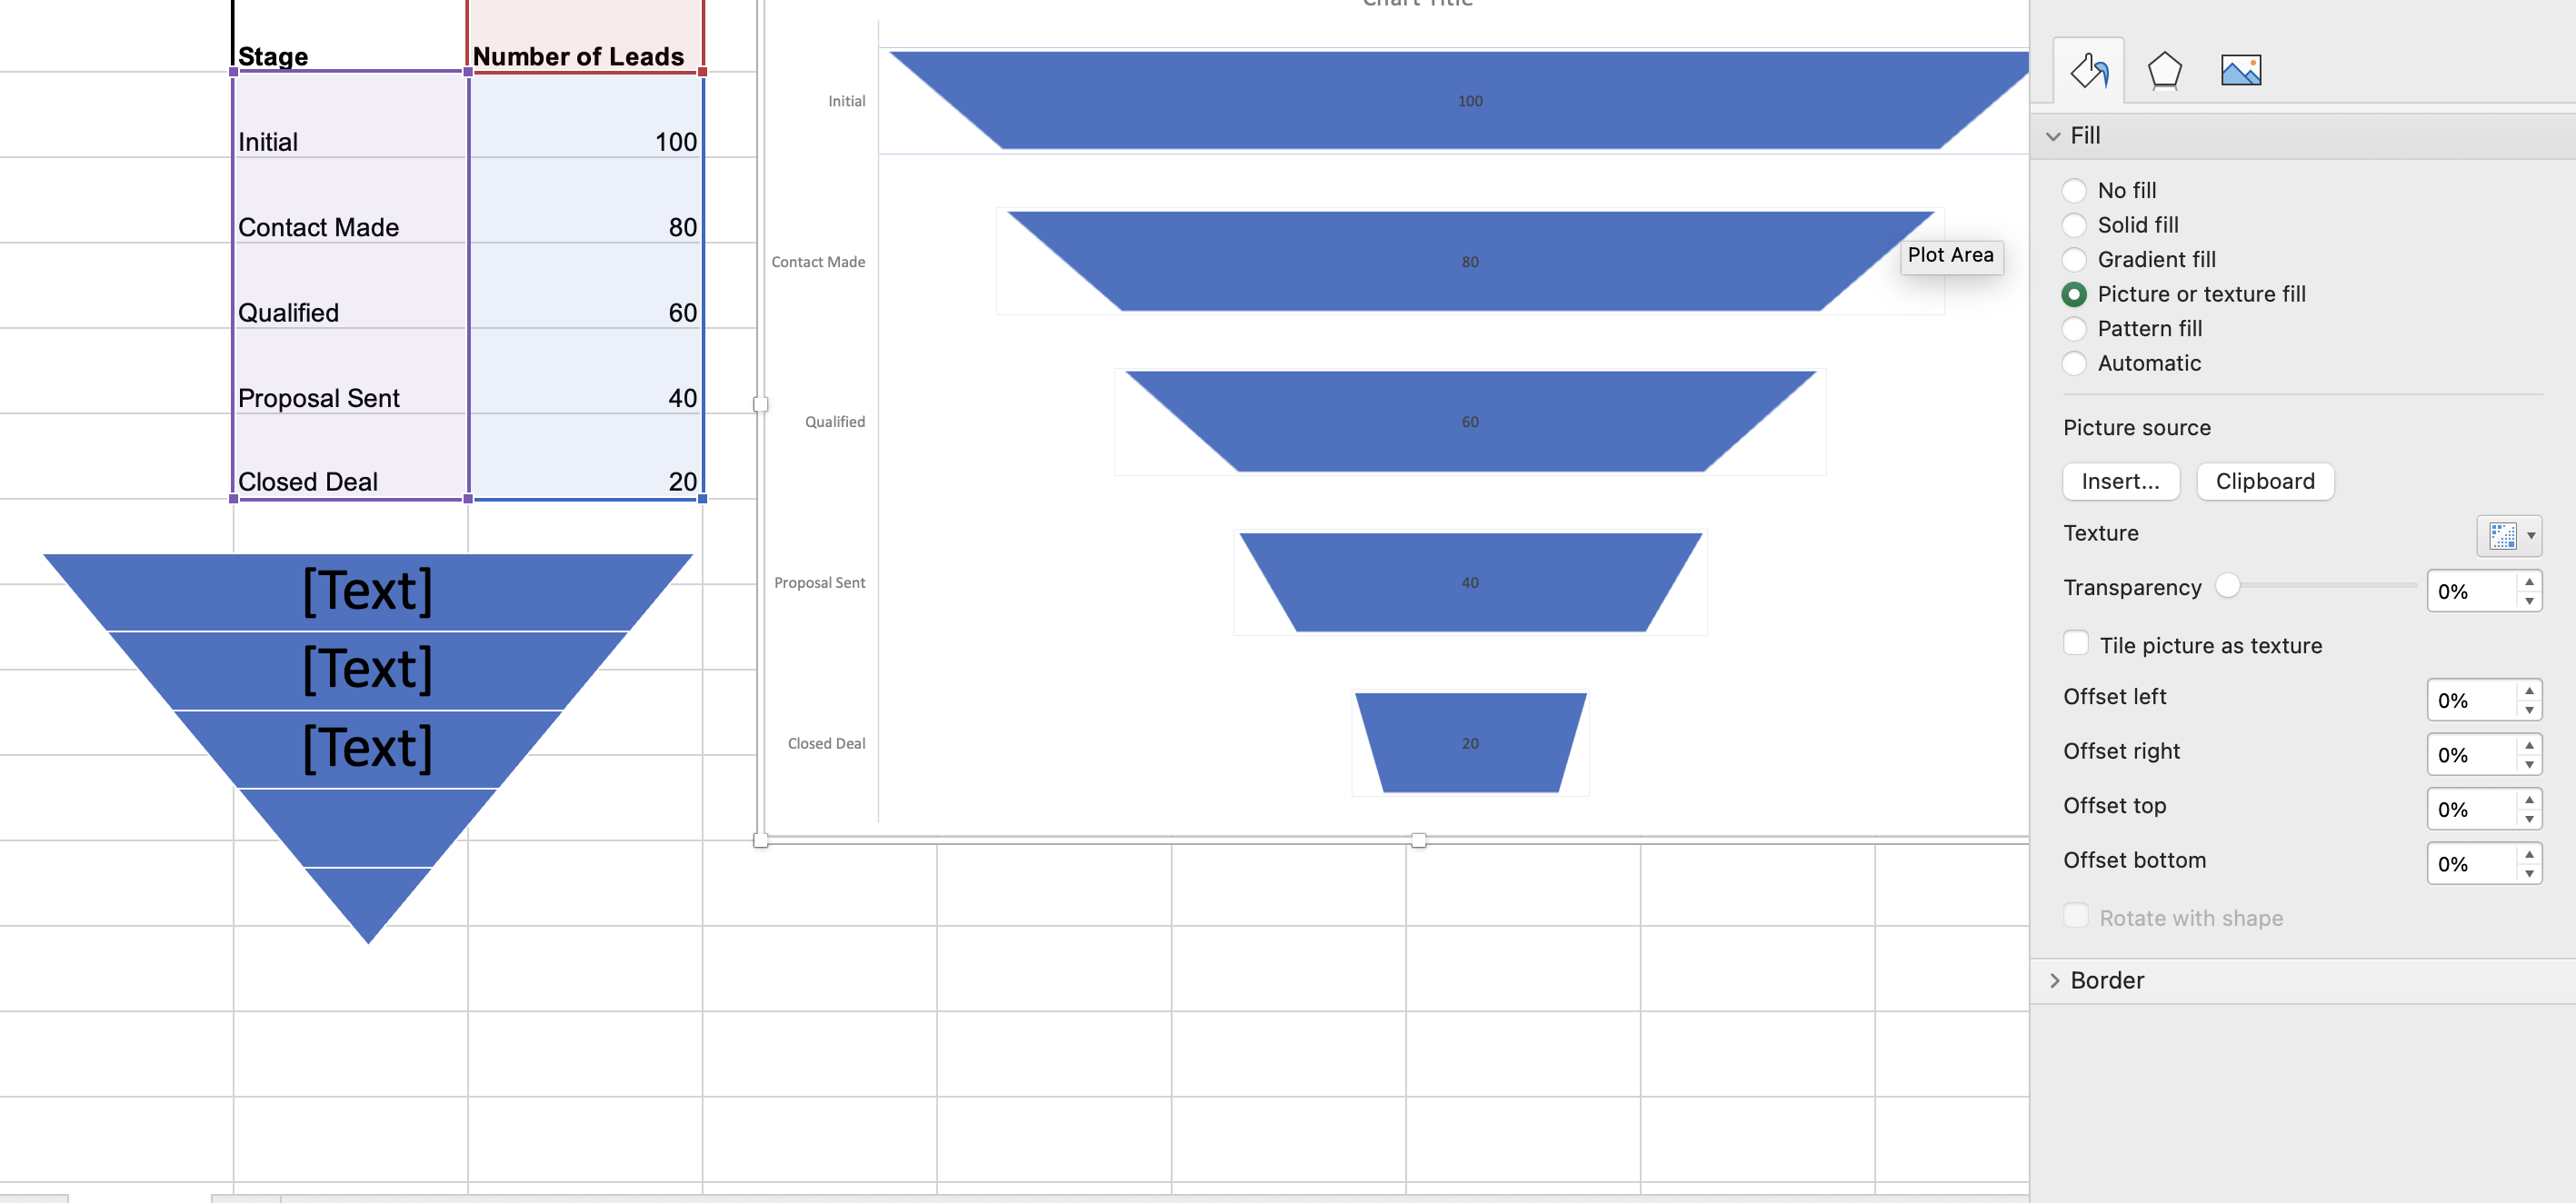
Now, do the exact same procedure for all the other shapes. Copy the exact shape and select the same shape from the funnel chart to fill the picture from the clipboard.
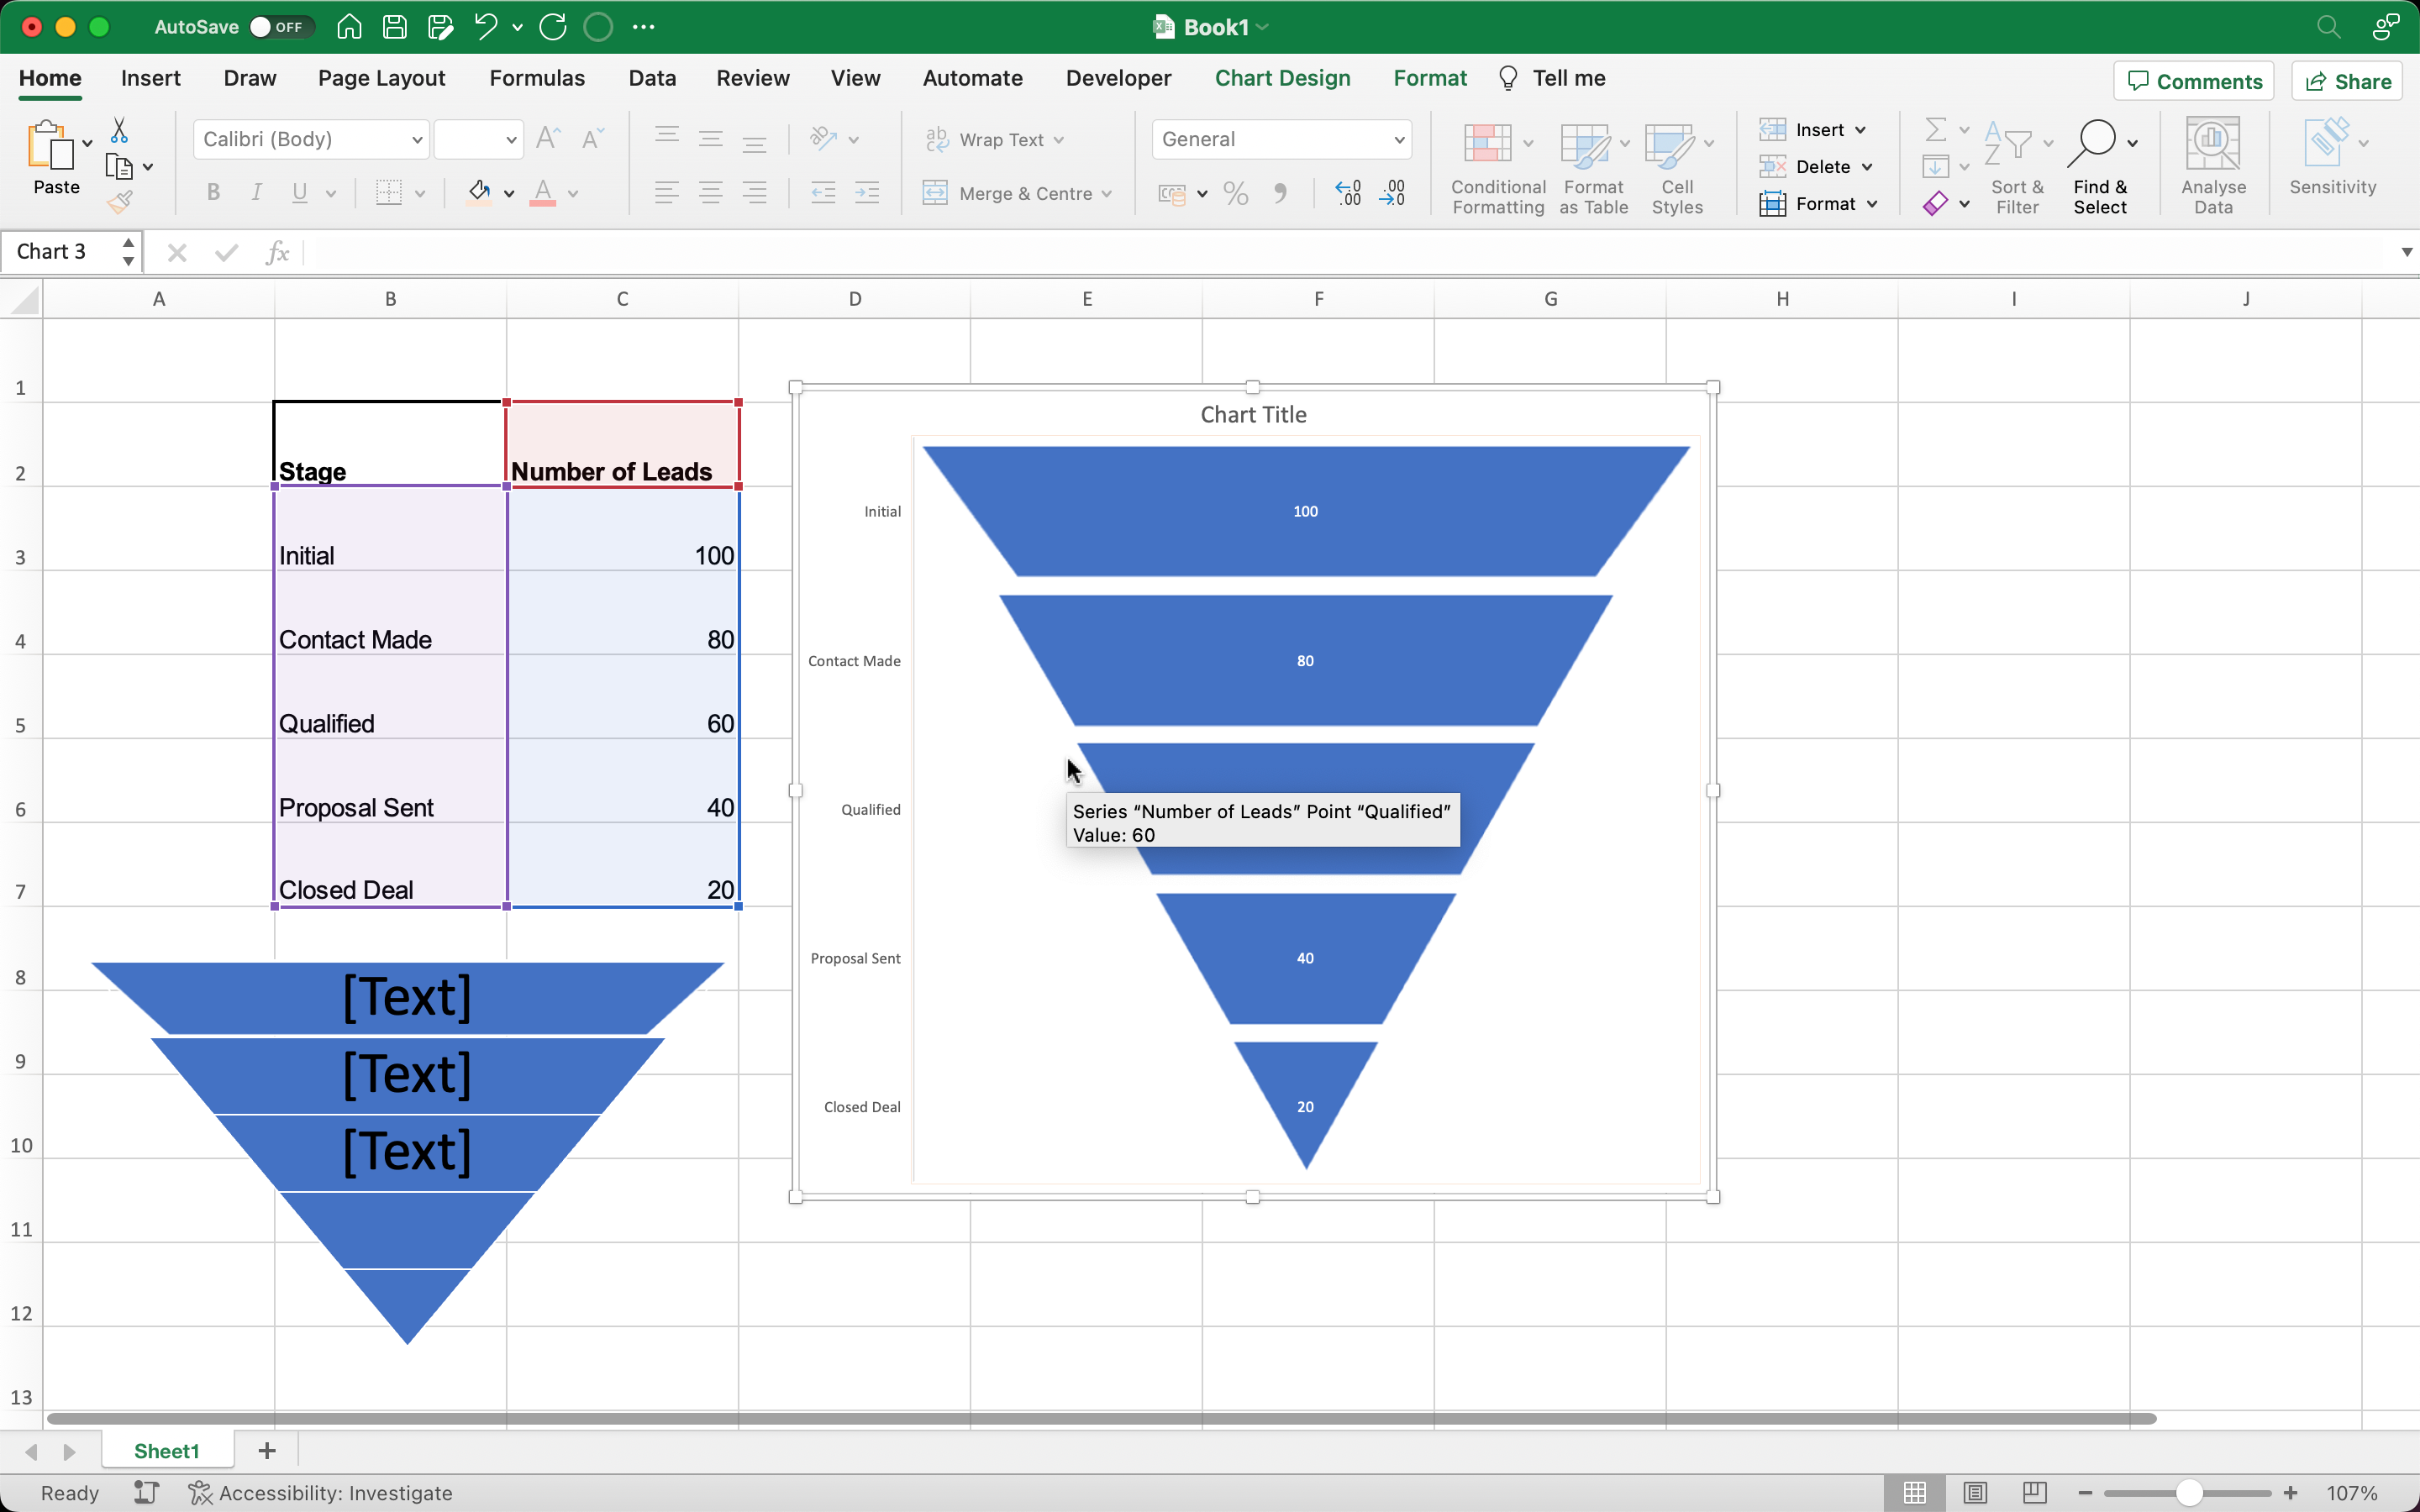
After you’ve followed each and every step, you will be left with a funnel chart like this.
How To Add Data Labels to a Funnel Chart in Excel
To add data labels to your existing funnel diagram, double click on the chart and go to the Chart Design Options. Now, select the Add Chart Elements Option from the left side of the ribbon bar. Click on the Data Labels option and choose More Data Label Options if you want to modify some.
There is another way to add data labels. If your existing chart already has some values written inside, double click on that value. This will open up the formatting options. Modify the data labels as per your requirements.
Why is a Funnel Diagram used in Excel?
A Funnel diagram is required to represent the progressive stages of a process or a series of data points. If you are more into a marketing sector, you will find it beneficial in analyzing and illustrating the conversion rates at each stage of a marketing funnel.
Other reasons why a funnel chart is necessary are–
- Process Optimization: You can track and analyze the progression of tasks, identify potential inefficiencies, and make data-driven decisions to optimize the process.
- Website or App User Flow: We find funnel diagrams useful for our website. It allows us to track the number of users at different stages of the user flow, such as landing page visits, account registrations, product views, and purchases.
- Sales Pipeline Analysis: Business strategies are often hectic. Yet we need to know the reason for slow and fast paced growth. A Funnel diagram allows us to visually inspect data and quickly identify areas where the conversion rates are high or low.
In short,
To gain insights, communicate information effectively, and drive improvements in your business processes, the use of a funnel chart is often the best solution.
How To Make a Funnel Chart in Google Sheets
You can also make a funnel chart in google sheets just like you did with multiple measures in excel. The technique is a little bit different as google sheets doesn’t have the in-built funnel chart.
So, how to create a funnel chart in google sheets?
Here are the steps to create a funnel graph in google sheets:
- Create a helper column that will contain the dummy values for pushing the actual values to the center of the chart.
- Insert a stacked bar chart.
- Hide the helper column data by clicking on it and selecting the No Fill Option.
- Reverse the axis categories.
- Recolor the chart and adjust the spacer width.
- Add data labels and remove unnecessary chart elements.
The steps we mentioned just now work perfectly if you are using older Excel versions like 2012 or lower.
FAQ
Q: Is there a funnel chart in Excel?
A: You will see funnel charts in Excel if you are using Microsoft Excel 2016 or later or a Microsoft 365 subscription plan. However, any version below that won’t show any other chart options except bar, column, and pie charts.
Q: How many steps in a sales funnel?
A: The minimum amount of steps in a sales funnel is 3. A basic marketing funnel has three stages, the initial, the middle, and the final outcomes. You can add more steps in the middle stages if needed.
Conclusion
Funnel charts are not limited to sales and marketing. They can be used to visualize the efficiency of any process with multiple stages.
As of now, you can make your own sales funnel chart template and use it when necessary. But do ensure that you insert a helper column if you are using Microsoft 2010 or lower.