
There are several ways and functions available through which you can easily calculate cumulative percentage in Excel. The use of Excel functions allows you to calculate these cumulative percentages for a large range of data in seconds, rather than having to do it manually for each individual row.
Consider the following scenario: you get your test results and are really pleased with the results. Till one of your relatives wants to know what percentage you are now in. To put it another way, what is your overall percentage of the result?
This is certainly when you will discover that you have not yet done quite as well as you had hoped in the play! Hence, putting aside the dry humor, the cumulative percentage in Excel is a very useful tool for expressing or analyzing a frequency distribution.
It is possible to get an accurate estimate of the proportion of values in the range that fall above or below a specific value by using this method.
So, if you don’t know how to do that, don’t worry. In this post, we will be showing you how to calculate cumulative percentage in Excel quite easily.
What is Cumulative Percentage, and What’s the Use of it?
If you are unfamiliar with the term Cumulative Percentage, the following is an explanation for you:
The percentage values that occur over a series of results are shown as a cumulative total. It is possible that the sum will stay the same or grow, hitting the greatest possible amount of 100 percent after adding every one of the preceding percentages together.
To put it another way, the cumulative percentage of a number or range is the percentage of the probable frequency for that number (or range) in a certain distribution.
Also, it may well be thought of as a running total of a percentage value, with the percentage increase for each value-added to the cumulative total. It’s often true that the cumulative proportion of the final value in the distributions (the maximum value) is 100 percent.
Thus, it provides us with an excellent understanding of how the percentages inside a frequency table accumulate over a duration of time.
Additionally, you may use the cumulative percentage to determine what proportion of students had a grade that was lower than a specified one.
If you discover that the cumulative frequency is, like, 75 is 30 percent, this implies that 30 percent of the students who took the exam had a score of less than 75 percent. You might also argue that 70% of the kids received a score of much more than 75 points.
In fact, the cumulative percentage has a wide range of applications that are not restricted to the above-shown example. In a variety of areas, such as scientific investigation, banking, accounting, and other financial services, it is a commonly used analytical analysis tool.
Now, let’s move on to the main topic of this, calculating the cumulative percentage in the Excel article.
5 Easy Ways to Calculate Cumulative Percentage in Excel
After doing some research, we’ve discovered the simplest and most useful 5 approaches on this matter, and you may choose from any of these after gaining some valuable information by studying these procedures.
Those methods are:
1. Manually Calculate Cumulative Frequency and Get the Cumulative Frequency Percentage
Consider the following scenario: a corporate organization began its operations in 2013. With the use of Cumulative Frequency, which is also known as running total, and running total percentage, which is known as Cumulative Percentage, they wish to see how their product sales count has progressed over the course of ten years in the company.
In the image below, you can see the information, which needs you to discover Cumulative Frequency and also Cumulative Percentage on two specific columns, as seen in the image below.
Now, to get the percentage, follow the steps below with each part:
Part 1:
- Open the spreadsheet and choose cell C2.
- Now enter the following formula in the cell: =B2
- Then hit the Enter button on your keyboard.
In this way, in Cell C2, you have just specified the beginning point for the calculation of cumulative frequency.
Part 2:
- Select cell C3 and enter the following formula: =B3+C2
- As a result of this procedure, you are combining sales from 2014 with those from the prior year.
- Select cell C3 and use the Fill Handle option to copy and paste the formula all the way to the bottom cell.
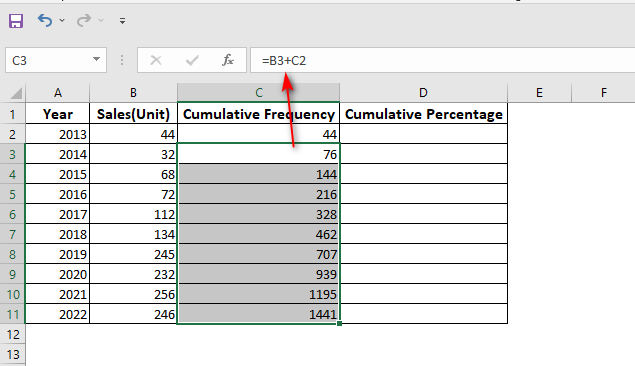
In this way, your cumulative sales for all years will be sent to the cell in one lump!
Part 3
- Then choose all of the cells in Column D, which is where you will be calculating the cumulative percentages.
- On the Home bar or tab, pick the Percentage option from the drop-down menu in the Number group of commands.
It will make certain that the divided numbers in Column D are converted to percentages.
Part 4:
- In Cell D2, divide C2 (the first number from the cumulative frequency) with C11 to get the answer of Total Sales.
- After choosing Cell C11 in the Function Bar, you must lock the cell by hitting the F4 key on your keyboard.
Because without locking Cell C11, cumulative percentages will appear as errors in the remaining cells in Column D until you lock this cell first.
Part 5:
- Now choose cell D2 and use the Fill Handle option to copy and paste the formula all the way to the bottom cell.
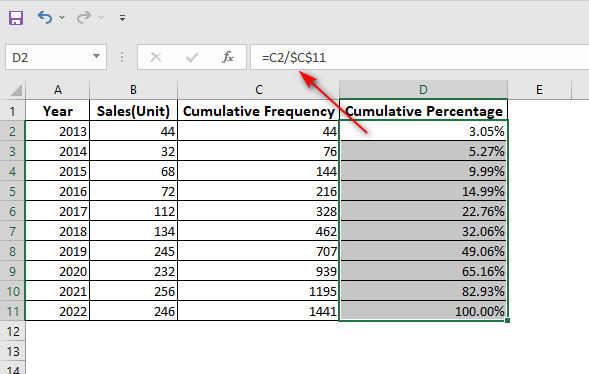
Now, once you have done all the steps above, you have just received the cumulative percentages of all sales throughout the course of a year.
2. By Applying Data Range and Intervals into Histogram
A Histogram may also be used to calculate cumulative percentages, which is useful. Using the prior worksheet, let’s go ahead and do this task.
In this section, you must provide a series of ranges or intervals, and the Histogram chart will display the frequency percentages for each of these ranges or intervals.
But first, to follow this method, you will have to get the Data Analysis command under the Data ribbon. After getting the command, you will have to enable it.
So, to do that, follow the below steps:
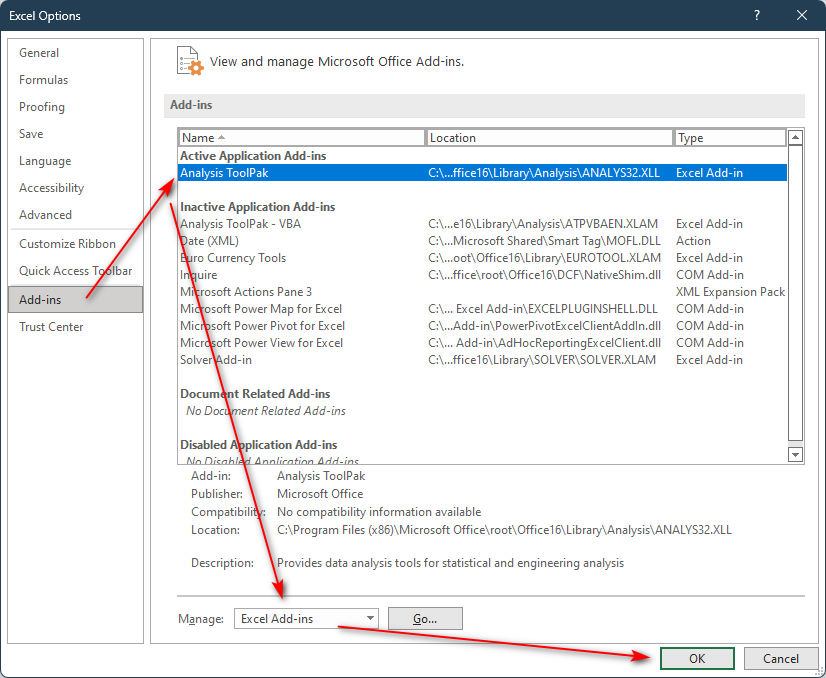
- Select Options from the File menu on the left.
- Choose Add-ins from the left-hand side menu.
- When you choose Analysis ToolPack from the Addons section, you’ll see Excel Add-ins in the Manage
- Click on the OK
Now you have got the Data Analysis option on the Data ribbon.
- Click on the Data ribbon and choose the Data Analysis option, which is located on the Analysis groups.
- Select the Histogram option in the Analysis Tools section and click on the OK
Now, let’s move on to the main steps:
Part 1:
- After clicking the Histogram option by following the previous steps, the Histogram window will appear.
- In the Input Range: select the Cell Ranges B2:B11.
- Enter the Range or Intervals within the Bin Range.
- Select the F2 Cell as the Output Range
- Place a checkmark next to Cumulative Percentage and Chart Output.
- Click on the OK
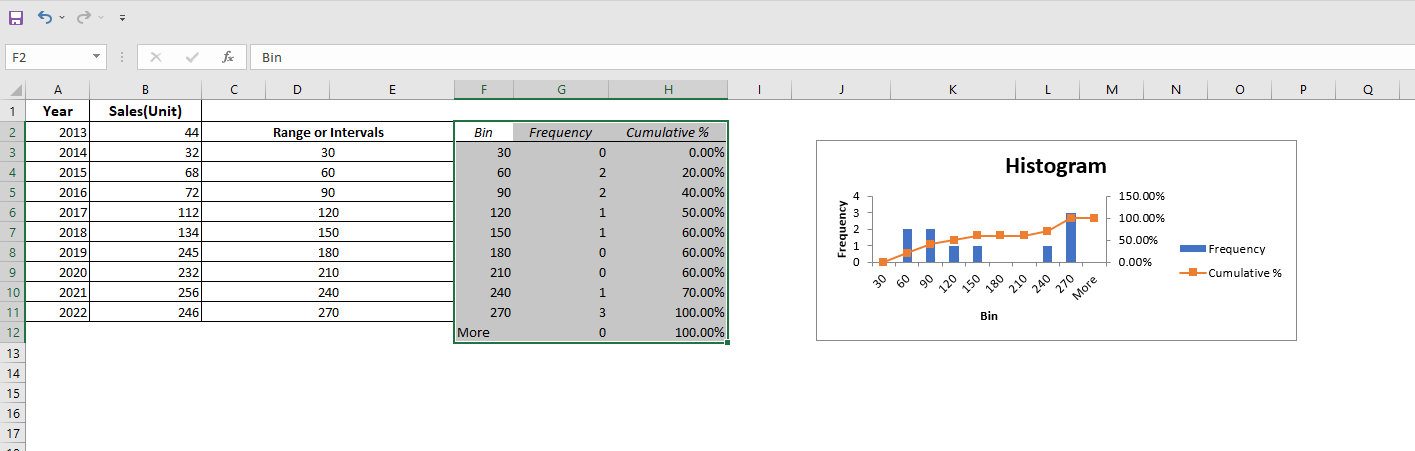
Now, you’ll discover the Cumulative Percentages, as well as a Histogram Chart, where you may further personalize the display by selecting from a variety of variables.
Using this approach, you will not be able to obtain the cumulative sales frequencies or percentages from year to year; nonetheless, this Histogram will provide you with an indication of the frequency of the sales range over the last ten years. You’ll be able to determine whether the range of your sales is the most important or least important over the course of many years.
3. By Creating an Excel Pivot Table to Get Cumulative Percentage
In the event that you want to build a Pivot Table, calculating the Cumulative Percentage will be simpler and more time-efficient. Now we’ll develop this Pivot Table for a spreadsheet that is comparable to the one we discussed before.
Part 1:
- Click on the Home tab and choose Analyze Data from the Analyze section. Then the side window of Analyze Data will appear.
- Click on the Insert PivotTable option on the bottom.
You’ll notice a new sheet in which the default value for the Sum of Sales will be shown.
You must, however, calculate a cumulative percentage at this point.
Part 2:
- Select Cell B3 and double-click on it. A toolbox titled Value Field Settings will open on the screen.
- Select the Show Value As bar option.
Part 3:
- Enter Cumulative Percentage in the Custom Name field instead of Sum of Sales to complete the adjustment.
- Now on the Show Values As drop-down menu, click on the % Running Total In
- Click on the OK
The Cumulative Percentages should now be seen in Column B of the spreadsheet. The Unit Sales data has just been converted into Cumulative Percentages, which will be shown year after year.
4. Getting the Percentage of the Unit Values to Calculate Cumulative Percentage In Excel
Let’s try to find the cumulative percentage using a different way this time.
Part 1:
- Cell B12 is the one you want to choose.
- Inside the Function Bar, type =SUM(B2:B11) to add all of the Sales values together.
- When you hit Enter, you’ll see that the total number of units sold is 1441.
Part 2:
- Now choose columns C and D.
- Select Percentage from the drop-down menu in the Number group on the Home tab.
In this way, the values in Columns C and D will be converted into a percentage value.
Part 3:
- Choose cell C2 and enter the following formula on it to show the sales percentage in the year 2013: =B2/B12
To avoid Value Error, ensure that B12 Cell has been locked by hitting F4 immediately after inputting B12; else, all the other sales percentages will be displayed as Value Error since the Sales numbers will be split by empty cells in a sequential manner beneath B12 Cell.
Part 4:
- Using the Fill Handle option, you may drag or fill the cells from C2 to C11 all the way down.
- In Cell D2, write =C2, and the number from Cell C2 will be copied to Cell D2.
- Now choose Cell D3 and insert =C3+D2.
- Now choose cell D3 and use the Fill Handle option to copy and paste the formula all the way to the bottom cell.
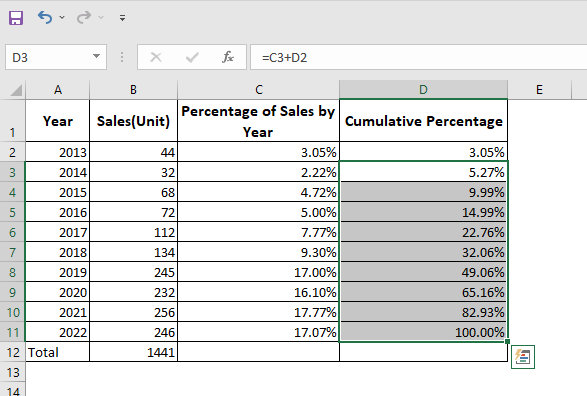
And you will get the cumulative percentage values instantly.
5. Using the Sum Function to Calculate Cumulative Frequency and Percentage
You may also use the Sum function, in this case, to compute cumulative frequency first, as shown below:
Part 1:
- Choose the cell C2 and write: =SUM($B$2:B2)
Now, lock the B2 cell just like the previous way by clicking on the F4 button.
Part 2:
- Now choose cell C2 and use the Fill Handle option to copy and paste the formula all the way to the bottom cell C11.
Now you got the cumulative frequencies of all sales at this point.
Part 3:
- Choose cell D2 and write =C2/$C$11 to divide the C2 value by the Total Sales of cell C11.
- Now use the fill handle to copy it to the remaining cells below.
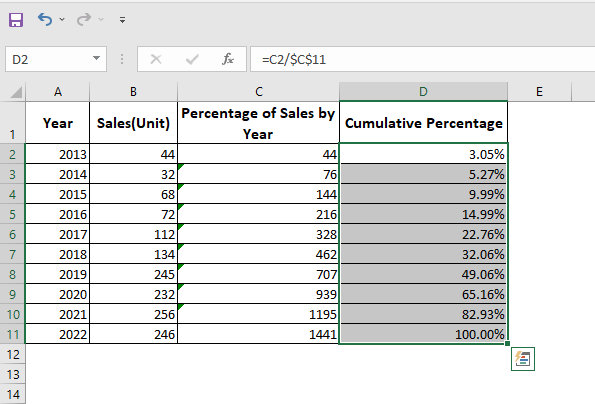
Now we got the cumulative percentage values.
You must lock Cell C11 since you will be dividing all Sales values from Column C by just Cell C11 on a consistent basis.
It is important to remember to activate the Percentage formatting for Column D by selecting it from the drop-down menu in the Number group.
Conclusion
Calculating the cumulative percentage in Excel is very easy when you know how to do it. We hope that this article has helped you to know how to calculate cumulative percentages in Excel.