
Let’s say that you are the manager of a small retail store and you want to analyze your sales data for the past year to identify trends and make better business decisions. To do this, you decide to use graphs in Excel to visualize your sales data.
Nothing in Excel is easy! Except making two tables and inserting a chart accordingly.
Graphs, also known as charts, are used in Excel to visually represent and analyze data.
Sometimes, however, you may need to combine two graphs in order to get a clear picture of your data.
Just as a chef combines different ingredients to create a delicious dish, combining graphs in a creative way can produce a unique and visually striking piece of art.
In this post, I will walk you through the process of combining two graphs in Excel in a step-by-step manner. So, don’t get lost and keep along.

How to Combine Two Graphs in Excel
Excel provides a lot of chart types, including bar, column, and pie charts. And to combine them, I will show you some step-by-step process.
You might ask:
How to Add a Chart to Another Chart in Excel?
So, here are the steps to combine two graphs in Excel:
1. Create the First Graph
The first step in combining two graphs is to create the first graph that you want to include in your combined chart. To do this, you will need to select the data that you want to graph and choose the chart type that you want to use.
i. Select the data that you want to graph:
You can select your data by clicking and dragging your mouse over the cells that contain your data table. Make sure that you include any column or row headings that you want to use in your graph. 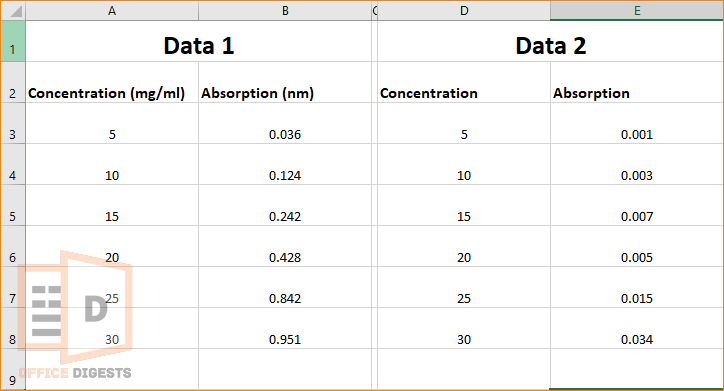
ii. Choose the chart type:
To choose the chart type that you want to use, click on the Insert tab in Excel’s ribbon, and then select the chart type that you want to use from the Charts group. For example, if you want to create a bar chart, you would select Bar from the Charts group. 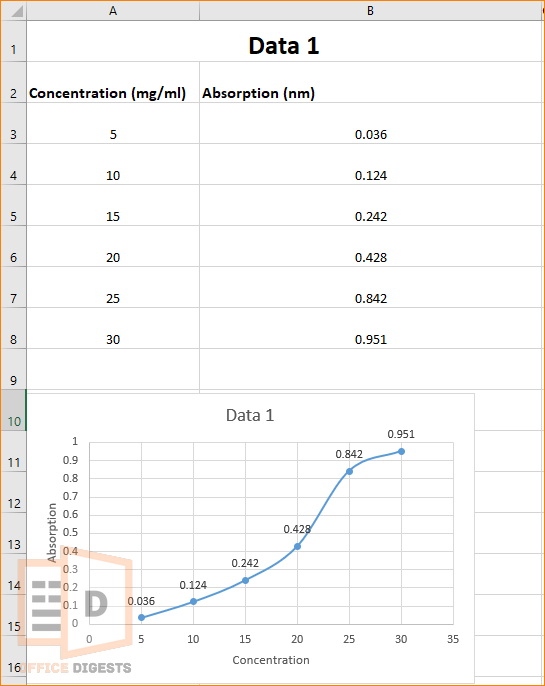
iii. Format the chart:
Once you have created your chart, you can format it to make it more visually appealing. To format your chart, click on it to select it, and then use the formatting options that appear in Excel’s ribbon to adjust the chart’s colors, fonts, and other visual elements. 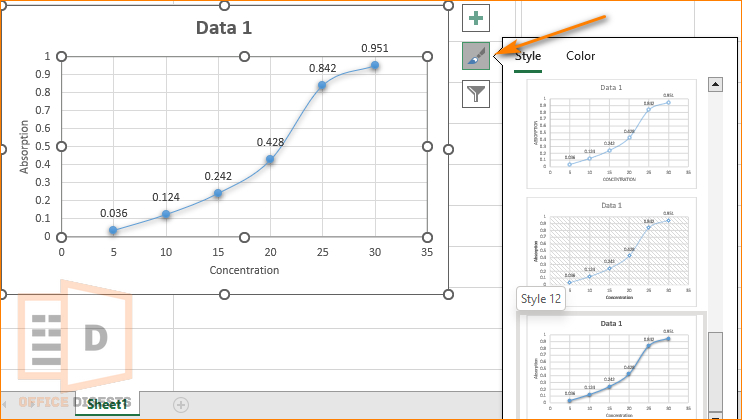
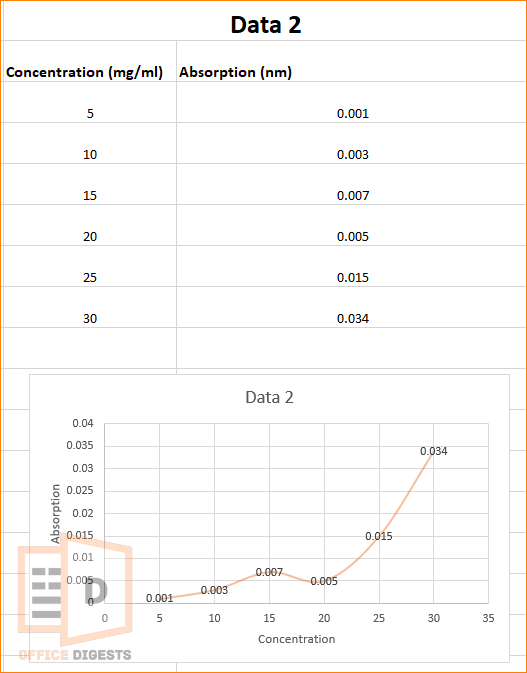
2. Create the Second Graph
After you have created your first graph, you will need to create the second graph that you want to include in your combined chart. To do this, you will follow the same process that you used to create the first graph.
But this time, select different data and a different chart type.
3. Combine the Graphs
Now that you have created your two graphs, you can combine them into a single chart.
There are several ways to do this in Excel, but I will focus on two method:
a. using the Combo chart type and b. using Excel’s Secondary Axis feature.
Method 1: Use the Combo Chart Type
i. Select the First Chart:
To use the combo chart type, you will need to start by selecting one of your charts. Make sure that you have clicked on the chart itself, not just on the data that it contains.
ii. Add the second chart:
With your first chart selected, click on the Design tab in Excel’s ribbon. Then, click on the Change Chart Type button. In the “Change Chart Type” dialog box, select the Combo chart type. This will allow you to add your second chart to the first chart.
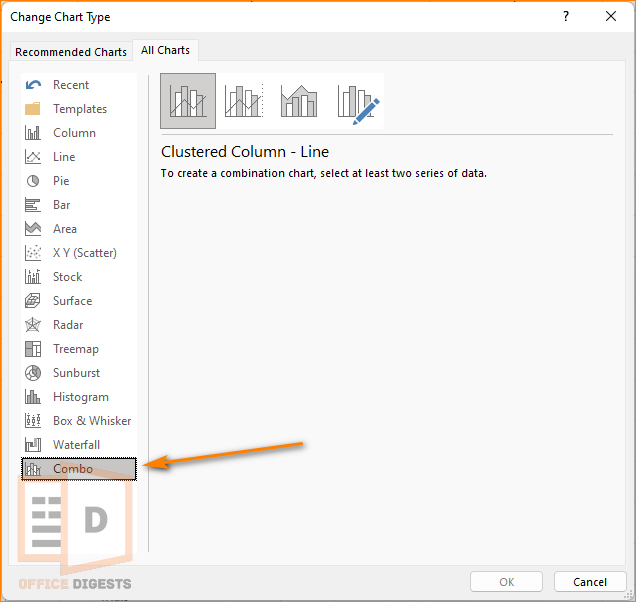
iii. Choose the chart type for the second series:
In the “Combo” chart type dialog box, you can choose the chart type that you want to use for your second series. This will allow you to show both series of data on a single chart. For example, if you want to show a line chart and a bar chart on the same graph, you would select Line for the first series and Clustered Column for the second series.
iv. Format the combined chart:
Once you have added your second chart to the first chart, you can format the combined chart to make it more visually appealing. You can adjust the colors, fonts, and other visual elements of the chart to make it match your preferences.
Method 2: Use Excel’s Secondary Axis Feature
To use Excel’s secondary axis feature, you will need to start by selecting one of your charts.
i. Add the second series to the chart:
With your first chart selected, click on the “Design” tab in Excel’s ribbon. Then, click on the “Select Data” button in the “Data” group. In the “Select Data Source” dialog box, click on the “Add” button to add your second series to the chart.
ii. Choose the chart type for the second series:
In the “Select Data Source” dialog box, you can choose the chart type that you want to use for your second series. This will allow you to show both series of data on a single chart. For example, if you want to show a line chart and a bar chart on the same chart, you would select “Line” for the first series and “Column” for the second series.
iii. Add a secondary axis:
After you have added your second series to the chart, you can add a secondary axis to the chart. To do this, click on the “Format” tab in Excel’s ribbon, and then click on the “Add Chart Element” button in the “Current Selection” group. Select “Secondary Vertical Axis” from the dropdown menu.
iv. Format the combined chart:
Once you have added your secondary axis to the chart, you can format the combined chart to make it more visually appealing. You can adjust the colors, fonts, and other visual elements of the chart to make it match your preferences.
How To Overlay Two Line Graphs in Excel
You can use the copy and paste option to merge two line graphs in Excel.
Copy and Pasting always make the work easy.
Select the first graph and press Ctrl + C to copy the graph. You can also right-click on the graph itself and select the copy option. After that, paste the first graph on the second one. Use Ctrl+V or right-click on the second graph and select the paste option.
Final Words
Combining two graphs in Excel can help you visualize your data more effectively and make it easier to draw conclusions from your data.
By following the steps outlined in this post, you can create a combined chart that shows two sets of data on a single chart.
Whether you choose to use the “Combo” chart type or Excel’s secondary axis feature, you can create a visually appealing chart that helps you make better decisions based on your data. With a little practice and experimentation, you can become proficient at combining graphs in Excel and unlock new insights from your data.